Python如何实现多元线性回归?在本教程中,你将看到如何使用
sklearn和
statsmodels在 Python 中执行多元线性回归。
以下是这个Python多元线性回归教程要涵盖的主题:
- 查看本教程中要使用的示例
- 检查线性
- 在 Python 中执行多元线性回归
- 添加tkinter图形用户界面 以收集用户的输入,然后显示预测结果
Python多元线性回归示例
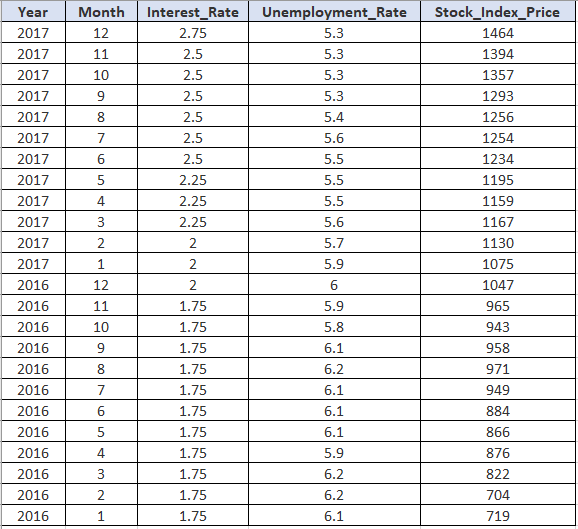
在以下示例中,我们将使用多元线性回归通过使用 2 个自变量/输入变量来预测虚构经济体的股票指数价格(即因变量):
请注意,在应用线性回归模型之前,你必须验证是否满足多个假设。最值得注意的是,你必须确保因变量和自变量之间存在线性关系(更多信息请
参见检查线性部分)。
现在让我们进入我们将使用的数据集:
Python多元线性回归代码示例:首先,你可以使用Pandas DataFrame在 Python 中捕获上述数据集 (对于更大的数据集,你可以考虑导入你的数据):
import pandas as pd

Stock_Market = {'Year': [2017,2017,2017,2017,2017,2017,2017,2017,2017,2017,2017,2017,2016,2016,2016,2016,2016,2016,2016,2016,2016,2016,2016,2016],
                'Month': [12, 11,10,9,8,7,6,5,4,3,2,1,12,11,10,9,8,7,6,5,4,3,2,1],
                'Interest_Rate': [2.75,2.5,2.5,2.5,2.5,2.5,2.5,2.25,2.25,2.25,2,2,2,1.75,1.75,1.75,1.75,1.75,1.75,1.75,1.75,1.75,1.75,1.75],
                'Unemployment_Rate': [5.3,5.3,5.3,5.3,5.4,5.6,5.5,5.5,5.5,5.6,5.7,5.9,6,5.9,5.8,6.1,6.2,6.1,6.1,6.1,5.9,6.2,6.2,6.1],
                'Stock_Index_Price': [1464,1394,1357,1293,1256,1254,1234,1195,1159,1167,1130,1075,1047,965,943,958,971,949,884,866,876,822,704,719]
                }

df = pd.DataFrame(Stock_Market,columns=['Year','Month','Interest_Rate','Unemployment_Rate','Stock_Index_Price'])

print (df)
Python多元线性回归教程:检查线性
在执行线性回归模型之前,建议验证是否满足某些假设。
如前所述,你可能需要检查因变量和自变量之间是否存在线性关系。
在我们的示例中,你可能想要检查以下各项之间是否存在线性关系:
- Stock_Index_Price(因变量)和 Interest_Rate(自变量)
- Stock_Index_Price(因变量)和 Unemployment_Rate(自变量)
要执行快速线性检查,你可以使用散点图(利用
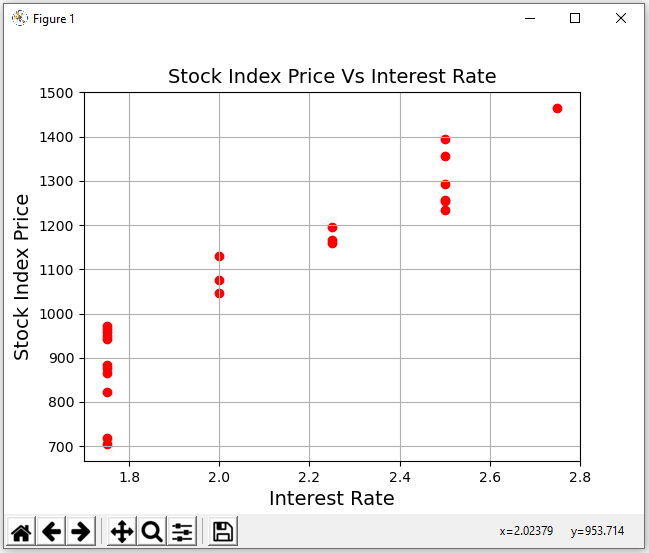
matplotlib 库)。例如,你可以使用下面的代码来绘制 Stock_Index_Price 和 Interest_Rate 之间的关系,如下Python多元线性回归代码示例:
import pandas as pd
import matplotlib.pyplot as plt

Stock_Market = {'Year': [2017,2017,2017,2017,2017,2017,2017,2017,2017,2017,2017,2017,2016,2016,2016,2016,2016,2016,2016,2016,2016,2016,2016,2016],
                'Month': [12, 11,10,9,8,7,6,5,4,3,2,1,12,11,10,9,8,7,6,5,4,3,2,1],
                'Interest_Rate': [2.75,2.5,2.5,2.5,2.5,2.5,2.5,2.25,2.25,2.25,2,2,2,1.75,1.75,1.75,1.75,1.75,1.75,1.75,1.75,1.75,1.75,1.75],
                'Unemployment_Rate': [5.3,5.3,5.3,5.3,5.4,5.6,5.5,5.5,5.5,5.6,5.7,5.9,6,5.9,5.8,6.1,6.2,6.1,6.1,6.1,5.9,6.2,6.2,6.1],
                'Stock_Index_Price': [1464,1394,1357,1293,1256,1254,1234,1195,1159,1167,1130,1075,1047,965,943,958,971,949,884,866,876,822,704,719]
                }

df = pd.DataFrame(Stock_Market,columns=['Year','Month','Interest_Rate','Unemployment_Rate','Stock_Index_Price'])

plt.scatter(df['Interest_Rate'], df['Stock_Index_Price'], color='red')
plt.title('Stock Index Price Vs Interest Rate', fontsize=14)
plt.xlabel('Interest Rate', fontsize=14)
plt.ylabel('Stock Index Price', fontsize=14)
plt.grid(True)
plt.show()
你会注意到 Stock_Index_Price 和 Interest_Rate 之间确实存在线性关系。具体来说,当利率上升时,股指价格也随之上升:
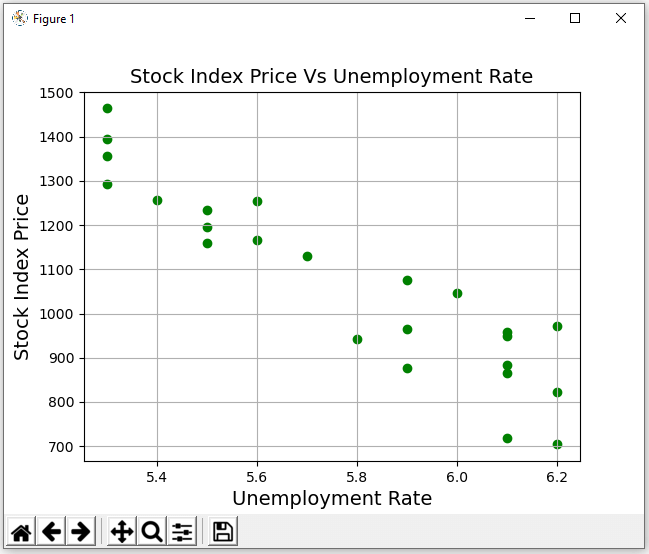
对于第二种情况,你可以使用此代码来绘制 Stock_Index_Price 和 Unemployment_Rate 之间的关系:
import pandas as pd
import matplotlib.pyplot as plt

Stock_Market = {'Year': [2017,2017,2017,2017,2017,2017,2017,2017,2017,2017,2017,2017,2016,2016,2016,2016,2016,2016,2016,2016,2016,2016,2016,2016],
                'Month': [12, 11,10,9,8,7,6,5,4,3,2,1,12,11,10,9,8,7,6,5,4,3,2,1],
                'Interest_Rate': [2.75,2.5,2.5,2.5,2.5,2.5,2.5,2.25,2.25,2.25,2,2,2,1.75,1.75,1.75,1.75,1.75,1.75,1.75,1.75,1.75,1.75,1.75],
                'Unemployment_Rate': [5.3,5.3,5.3,5.3,5.4,5.6,5.5,5.5,5.5,5.6,5.7,5.9,6,5.9,5.8,6.1,6.2,6.1,6.1,6.1,5.9,6.2,6.2,6.1],
                'Stock_Index_Price': [1464,1394,1357,1293,1256,1254,1234,1195,1159,1167,1130,1075,1047,965,943,958,971,949,884,866,876,822,704,719]
                }

df = pd.DataFrame(Stock_Market,columns=['Year','Month','Interest_Rate','Unemployment_Rate','Stock_Index_Price'])

plt.scatter(df['Unemployment_Rate'], df['Stock_Index_Price'], color='green')
plt.title('Stock Index Price Vs Unemployment Rate', fontsize=14)
plt.xlabel('Unemployment Rate', fontsize=14)
plt.ylabel('Stock Index Price', fontsize=14)
plt.grid(True)
plt.show()
如你所见,Stock_Index_Price 和 Unemployment_Rate 之间也存在线性关系——当失业率上升时,股票指数价格下降(这里我们仍然存在线性关系,但斜率为负):
Python如何实现多元线性回归?接下来,我们将在 Python 中执行实际的多元线性回归。
Python多元线性回归示例:执行多元线性回归
将数据添加到 Python 后,你可以同时使用 sklearn 和 statsmodels 来获得回归结果。
任何一种方法都可以,但为了说明目的,让我们回顾一下这两种方法。
然后,你可以将以下代码复制到 Python 中,下面是完整的Python多元线性回归代码示例:
import pandas as pd
from sklearn import linear_model
import statsmodels.api as sm

Stock_Market = {'Year': [2017,2017,2017,2017,2017,2017,2017,2017,2017,2017,2017,2017,2016,2016,2016,2016,2016,2016,2016,2016,2016,2016,2016,2016],
                'Month': [12, 11,10,9,8,7,6,5,4,3,2,1,12,11,10,9,8,7,6,5,4,3,2,1],
                'Interest_Rate': [2.75,2.5,2.5,2.5,2.5,2.5,2.5,2.25,2.25,2.25,2,2,2,1.75,1.75,1.75,1.75,1.75,1.75,1.75,1.75,1.75,1.75,1.75],
                'Unemployment_Rate': [5.3,5.3,5.3,5.3,5.4,5.6,5.5,5.5,5.5,5.6,5.7,5.9,6,5.9,5.8,6.1,6.2,6.1,6.1,6.1,5.9,6.2,6.2,6.1],
                'Stock_Index_Price': [1464,1394,1357,1293,1256,1254,1234,1195,1159,1167,1130,1075,1047,965,943,958,971,949,884,866,876,822,704,719]
                }

df = pd.DataFrame(Stock_Market,columns=['Year','Month','Interest_Rate','Unemployment_Rate','Stock_Index_Price'])

X = df[['Interest_Rate','Unemployment_Rate']] # here we have 2 variables for multiple regression. If you just want to use one variable for simple linear regression, then use X = df['Interest_Rate'] for example.Alternatively, you may add additional variables within the brackets
Y = df['Stock_Index_Price']

# with sklearn
regr = linear_model.LinearRegression()
regr.fit(X, Y)

print('Intercept: \n', regr.intercept_)
print('Coefficients: \n', regr.coef_)

# prediction with sklearn
New_Interest_Rate = 2.75
New_Unemployment_Rate = 5.3
print ('Predicted Stock Index Price: \n', regr.predict([[New_Interest_Rate ,New_Unemployment_Rate]]))

# with statsmodels
X = sm.add_constant(X) # adding a constant

model = sm.OLS(Y, X).fit()
predictions = model.predict(X)

print_model = model.summary()
print(print_model)
在 Python 中运行代码后,你将观察到三个部分:
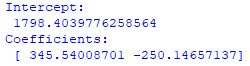
(1) 第一部分展示了sklearn生成的输出 :
该输出包括截距和系数。你可以使用此信息来构建多元线性回归方程,如下所示:
Stock_Index_Price = ( Intercept ) + ( Interest_Rate coef )*X
1 + ( Unemployment_Rate coef )*X
2
一旦你插入数字:
Stock_Index_Price = ( 1798.4040 ) + ( 345.5401 )*X
1 + ( -250.1466 )*X
2
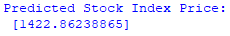
(2) 第二部分显示使用sklearn预测的输出 :
假设你要在收集以下数据后预测股票指数价格:
- 利率 = 2.75(即 X 1 = 2.75)
- 失业率 = 5.3(即 X 2 = 5.3)
如果将该数据插入回归方程,你将获得与第二部分中显示的相同的预测结果:
Stock_Index_Price = (1798.4040) + (345.5401)*(2.75) + (-250.1466)*(5.3) = 1422.86
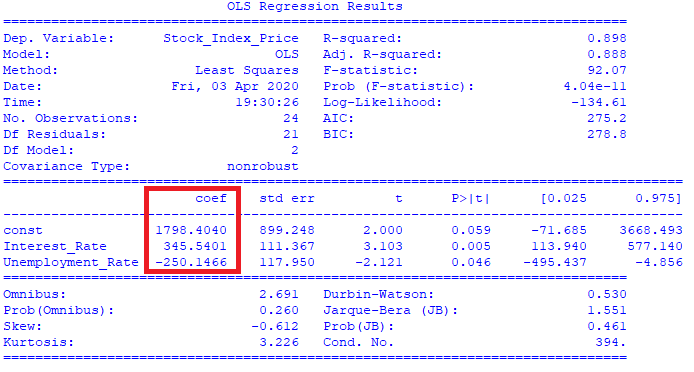
(3) 第三部分显示了一个综合表,其中包含statsmodels生成的统计信息。
Python如何实现多元线性回归?此信息可为你提供有关所用模型的其他见解(例如模型的拟合、标准误差等):
请注意,此表中捕获的系数(以红色突出显示)与 sklearn 生成的系数匹配。
这是个好兆头!我们通过应用 sklearn 和statsmodels得到了一致的结果。
接下来,你将看到如何在 Python 中创建 GUI 来收集用户的输入,然后显示预测结果。
Python多元线性回归示例:多元线性回归的 GUI
这才是真正有趣的开始!
Python多元线性回归教程:为什么不创建一个图形用户界面 (GUI),允许用户输入自变量以获得预测结果?
可能有些用户可能不太了解在 Python 代码本身中输入数据,因此为他们创建一个简单的界面是有意义的,他们可以在其中以简化的方式管理数据。
你甚至可以创建一个批处理文件来启动 Python 程序,因此用户只需双击批处理文件即可启动 GUI。
这是最终回归 GUI 的完整Python多元线性回归代码示例:
import pandas as pd
from sklearn import linear_model
import tkinter as tk
import matplotlib.pyplot as plt
from matplotlib.backends.backend_tkagg import FigureCanvasTkAgg

Stock_Market = {'Year': [2017,2017,2017,2017,2017,2017,2017,2017,2017,2017,2017,2017,2016,2016,2016,2016,2016,2016,2016,2016,2016,2016,2016,2016],
                'Month': [12, 11,10,9,8,7,6,5,4,3,2,1,12,11,10,9,8,7,6,5,4,3,2,1],
                'Interest_Rate': [2.75,2.5,2.5,2.5,2.5,2.5,2.5,2.25,2.25,2.25,2,2,2,1.75,1.75,1.75,1.75,1.75,1.75,1.75,1.75,1.75,1.75,1.75],
                'Unemployment_Rate': [5.3,5.3,5.3,5.3,5.4,5.6,5.5,5.5,5.5,5.6,5.7,5.9,6,5.9,5.8,6.1,6.2,6.1,6.1,6.1,5.9,6.2,6.2,6.1],
                'Stock_Index_Price': [1464,1394,1357,1293,1256,1254,1234,1195,1159,1167,1130,1075,1047,965,943,958,971,949,884,866,876,822,704,719]
                }

df = pd.DataFrame(Stock_Market,columns=['Year','Month','Interest_Rate','Unemployment_Rate','Stock_Index_Price'])

X = df[['Interest_Rate','Unemployment_Rate']].astype(float) # here we have 2 input variables for multiple regression. If you just want to use one variable for simple linear regression, then use X = df['Interest_Rate'] for example.Alternatively, you may add additional variables within the brackets
Y = df['Stock_Index_Price'].astype(float) # output variable (what we are trying to predict)

# with sklearn
regr = linear_model.LinearRegression()
regr.fit(X, Y)

print('Intercept: \n', regr.intercept_)
print('Coefficients: \n', regr.coef_)

# tkinter GUI
root= tk.Tk()

canvas1 = tk.Canvas(root, width = 500, height = 300)
canvas1.pack()

# with sklearn
Intercept_result = ('Intercept: ', regr.intercept_)
label_Intercept = tk.Label(root, text=Intercept_result, justify = 'center')
canvas1.create_window(260, 220, window=label_Intercept)

# with sklearn
Coefficients_result  = ('Coefficients: ', regr.coef_)
label_Coefficients = tk.Label(root, text=Coefficients_result, justify = 'center')
canvas1.create_window(260, 240, window=label_Coefficients)

# New_Interest_Rate label and input box
label1 = tk.Label(root, text='Type Interest Rate: ')
canvas1.create_window(100, 100, window=label1)

entry1 = tk.Entry (root) # create 1st entry box
canvas1.create_window(270, 100, window=entry1)

# New_Unemployment_Rate label and input box
label2 = tk.Label(root, text=' Type Unemployment Rate: ')
canvas1.create_window(120, 120, window=label2)

entry2 = tk.Entry (root) # create 2nd entry box
canvas1.create_window(270, 120, window=entry2)

def values():
    global New_Interest_Rate #our 1st input variable
    New_Interest_Rate = float(entry1.get())

    global New_Unemployment_Rate #our 2nd input variable
    New_Unemployment_Rate = float(entry2.get())

    Prediction_result  = ('Predicted Stock Index Price: ', regr.predict([[New_Interest_Rate ,New_Unemployment_Rate]]))
    label_Prediction = tk.Label(root, text= Prediction_result, bg='orange')
    canvas1.create_window(260, 280, window=label_Prediction)

button1 = tk.Button (root, text='Predict Stock Index Price',command=values, bg='orange') # button to call the 'values' command above
canvas1.create_window(270, 150, window=button1)

#plot 1st scatter
figure3 = plt.Figure(figsize=(5,4), dpi=100)
ax3 = figure3.add_subplot(111)
ax3.scatter(df['Interest_Rate'].astype(float),df['Stock_Index_Price'].astype(float), color = 'r')
scatter3 = FigureCanvasTkAgg(figure3, root)
scatter3.get_tk_widget().pack(side=tk.RIGHT, fill=tk.BOTH)
ax3.legend(['Stock_Index_Price'])
ax3.set_xlabel('Interest Rate')
ax3.set_title('Interest Rate Vs. Stock Index Price')

#plot 2nd scatter
figure4 = plt.Figure(figsize=(5,4), dpi=100)
ax4 = figure4.add_subplot(111)
ax4.scatter(df['Unemployment_Rate'].astype(float),df['Stock_Index_Price'].astype(float), color = 'g')
scatter4 = FigureCanvasTkAgg(figure4, root)
scatter4.get_tk_widget().pack(side=tk.RIGHT, fill=tk.BOTH)
ax4.legend(['Stock_Index_Price'])
ax4.set_xlabel('Unemployment_Rate')
ax4.set_title('Unemployment_Rate Vs. Stock Index Price')

root.mainloop()
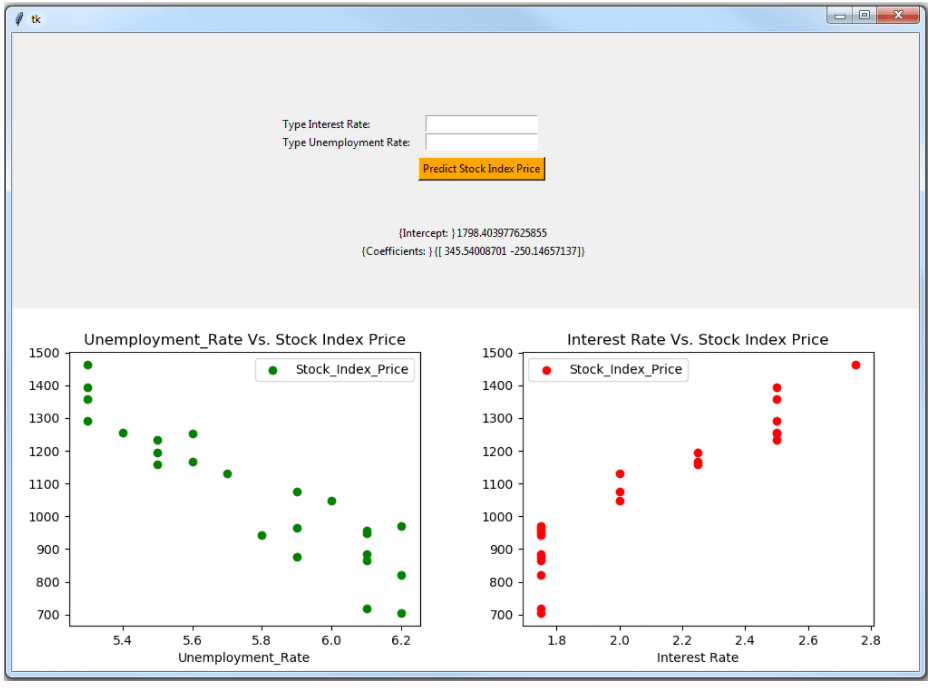
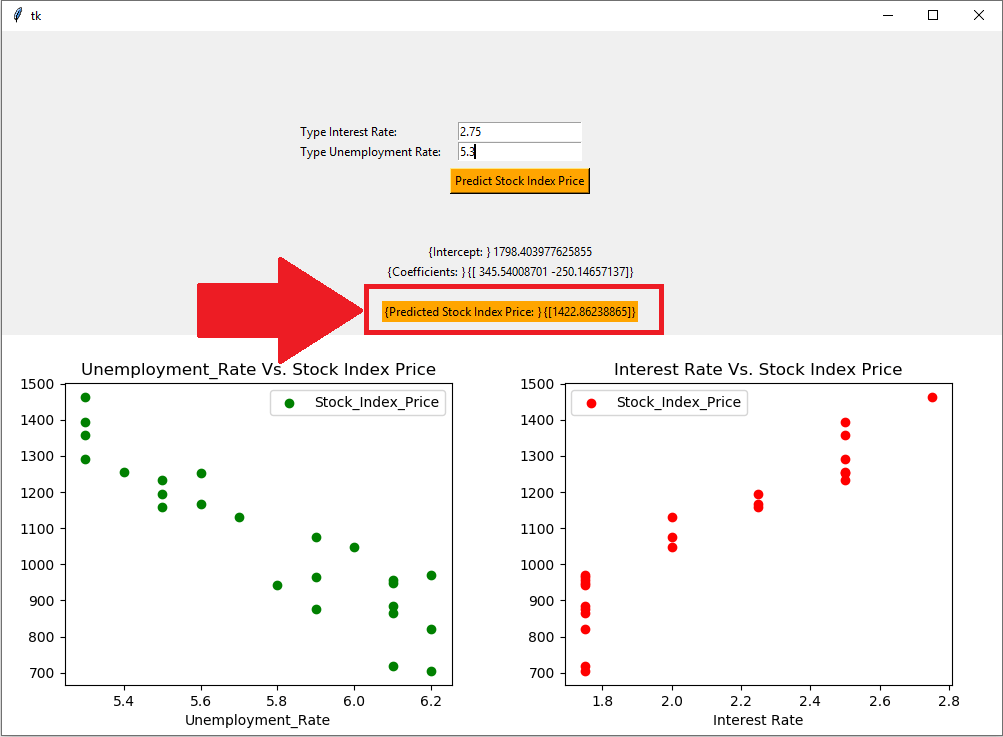
运行代码后,你将看到此 GUI,其中包括 sklearn 生成的输出和散点图:
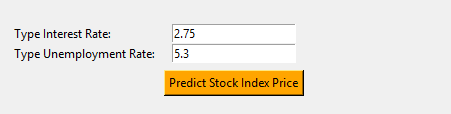
回想一下,我们之前使用以下值进行了预测:
在输入框中输入这些值,然后单击“预测股票指数价格”按钮:
你现在将看到 1422.86 的预测结果,它与你之前看到的值相匹配。
你可能还想查看以下教程以了解有关在 tkinter GUI 上嵌入图表的更多信息。
Python多元线性回归教程结论
Python如何实现多元线性回归?线性回归常用于机器学习,你已经看到了一些关于如何使用
sklearn和statsmodels实现Python多元线性回归示例。
在应用线性回归模型之前,请确保检查因变量(即你要预测的内容)和自变量(即输入变量)之间是否存在
线性关系。