
先决条件:了解逻辑回归
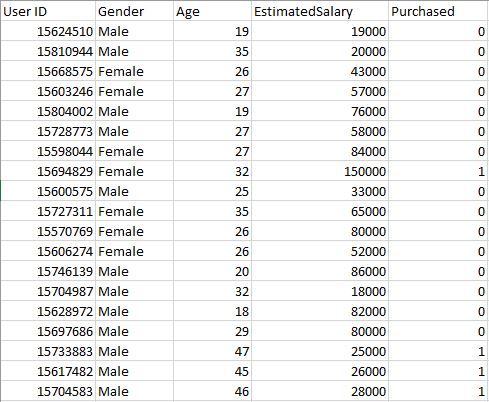
用户数据库–该数据集包含来自公司数据库的用户信息。它包含有关用户ID, 性别, 年龄, 预估工资, 已购买的信息。我们正在使用该数据集预测用户是否会购买公司的新产品。
数据–
用户数据
让我们建立Logistic回归模型, 预测用户是否会购买产品。
输入库
import pandas as pd
import numpy as np
import matplotlib.pyplot as plt
加载数据集– User_Data
dataset = pd.read_csv( '...\\User_Data.csv' )现在, 要预测用户是否会购买该产品, 需要找出年龄与估计工资之间的关系。用户ID和性别不是找出此问题的重要因素。
# input
x = dataset.iloc[:, [ 2 , 3 ]].values

# output
y = dataset.iloc[:, 4 ].values
分割数据集以进行训练和测试。 75%的数据用于训练模型, 而25%的数据用于测试模型的性能。
from sklearn.cross_validation import train_test_split
xtrain, xtest, ytrain, ytest = train_test_split(
         x, y, test_size = 0.25 , random_state = 0 )
现在, 在这里执行要素缩放非常重要, 因为"年龄"和"估计工资"值处于不同范围内。如果我们不对要素进行缩放, 则当模型在数据空间中找到与数据点最接近的邻居时, "估计工资"要素将主导"年龄"要素。
from sklearn.preprocessing import StandardScaler
sc_x = StandardScaler()
xtrain = sc_x.fit_transform(xtrain)
xtest = sc_x.transform(xtest)

print (xtrain[ 0 : 10 , :])
输出:
[[ 0.58164944 -0.88670699]
 [-0.60673761  1.46173768]
 [-0.01254409 -0.5677824 ]
 [-0.60673761  1.89663484]
 [ 1.37390747 -1.40858358]
 [ 1.47293972  0.99784738]
 [ 0.08648817 -0.79972756]
 [-0.01254409 -0.24885782]
 [-0.21060859 -0.5677824 ]
 [-0.21060859 -0.19087153]]
在这里, 曾经看到"年龄"和"估计的薪水"特征值是小数位数, 现在是-1:1。因此, 每个特征将在决策制定(即最终确定假设)中做出同等的贡献。
最后, 我们正在训练Logistic回归模型。
from sklearn.linear_model import LogisticRegression
classifier = LogisticRegression(random_state = 0 )
classifier.fit(xtrain, ytrain)
训练模型后, 是时候使用它对测试数据进行预测了。
y_pred = classifier.predict(xtest)让我们测试模型的性能-混淆矩阵
from sklearn.metrics import confusion_matrix
cm = confusion_matrix(ytest, y_pred)

print ( "Confusion Matrix : \n" , cm)
输出:
Confusion Matrix :
 [[65  3]
 [ 8 24]]
满分100
TruePostive + TrueNegative = 65 + 24
FalsePositive + FalseNegative = 3 + 8
绩效衡量–准确性
from sklearn.metrics import accuracy_score
print ( "Accuracy : " , accuracy_score(ytest, y_pred))
输出:
Accuracy : 0.89可视化我们模型的性能。
from matplotlib.colors import ListedColormap
X_set, y_set = xtest, ytest
X1, X2 = np.meshgrid(np.arange(start = X_set[:, 0 ]. min () - 1 , stop = X_set[:, 0 ]. max () + 1 , step = 0.01 ), np.arange(start = X_set[:, 1 ]. min () - 1 , stop = X_set[:, 1 ]. max () + 1 , step = 0.01 ))

plt.contourf(X1, X2, classifier.predict(
              np.array([X1.ravel(), X2.ravel()]).T).reshape(
              X1.shape), alpha = 0.75 , cmap = ListedColormap(( 'red' , 'green' )))

plt.xlim(X1. min (), X1. max ())
plt.ylim(X2. min (), X2. max ())

for i, j in enumerate (np.unique(y_set)):
     plt.scatter(X_set[y_set = = j, 0 ], X_set[y_set = = j, 1 ], c = ListedColormap(( 'red' , 'green' ))(i), label = j)

plt.title( 'Classifier (Test set)' )
plt.xlabel( 'Age' )
plt.ylabel( 'Estimated Salary' )
plt.legend()
plt.show()
输出:
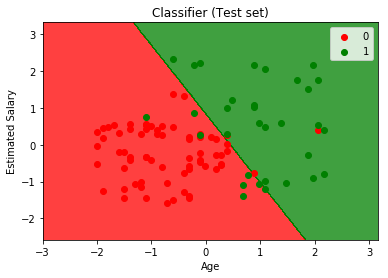
通过分析性能指标–准确性和混淆矩阵以及图表, 我们可以清楚地说出我们的模型的表现非常好。
首先, 你的面试准备可通过以下方式增强你的数据结构概念:Python DS课程。

