
了解如何使用 Node.js 在服务器中轻松地将使用 Highcharts 制作的图表渲染为图像。

考虑以下上下文,因为那是我几个月前发现的上下文。我正在开发一个在 PHP 7 上运行的大型 Symfony 项目,众所周知,在 PHP 中创建图表的库真的很糟糕。因此,选项是使用 JavaScript 中的替代解决方案简单地创建图表,因为图表应该只在用户使用应用程序时出现在浏览器上。不幸的是,几个月后,他们需要创建 PDF 报告,这些报告需要具有在浏览器上显示的相同图表(是的,太好了,我还需要将它们嵌入到 PDF 中)。就我当时所掌握的知识而言,情况非常成问题。
经过一番研究,我发现幸运的是,我在浏览器中使用 Highcharts 创建图表,因此在服务器端实现它的解决方案已经存在,因此我不需要在服务器上重写图表 - side作为前端图表的代码应该是相似的。
Node.js如何在服务器端渲染JavaScript Highcharts?在本文中,我将向你解释如何使用 Node.js 和highcharts-export-server模块轻松地在你的服务器上渲染 highcharts 。
要求
我们假设你的服务器上已经安装了 Node.js。
安装 Highcharts 导出服务器
服务器端渲染JavaScript Highcharts的方法:使用 的第一种方法highcharts-export-server是将其用作模块。这意味着,编写你自己的脚本,以自定义方式创建图表的图像版本。在这种情况下,我们将简单地创建一个脚本,该脚本将使用自定义代码来生成图表。第二种方法是将模块作为 HTTP 服务(作为服务器)运行,因此像你正在使用的第三方应用程序可以简单地向该服务器发出请求以获取图像作为响应。
第一步,使用 NPM 使用以下命令安装模块:
npm install highcharts-export-server安装将需要一段时间,因为这将安装 Highcharts 库和 PhantomJS。安装 highcharts 时,系统会提示你提供有关许可证和其他模块的信息,在我们的情况下,我们将使用免费版本,因此对大多数提示的答案将使用否。
有关 highcharts-export-server 模块的更多信息,请在此处访问 Github 的官方存储库。
A. 使用 Highcharts 导出服务器作为模块
有多种方法可以使用 highcharts 导出服务器导出图表。我将在本文中描述最有用的:
导出为 PNG 图像
Node.js如何在服务器端渲染JavaScript Highcharts?在此示例中,我们将创建将使用 Node.js 执行的 index.js 文件。该文件包含 highcharts 导出模块的基本实现,它将与文件系统模块一起导入。然后,初始化导出器(PhantomJS)并定义图表的选项。该对象chartOptions包含你照常用于在前端绘制图表的信息、标签、数据等。然后使用chartExporter的export方法运行在无头浏览器(PhantomJS)上绘制图表,当它被渲染时,浏览器会触发回调,让你获取图片的base64信息并存入文件:
// /index.js

// 1. Import filesystem and Highcharts Export Server module
const fs = require("fs");
const chartExporter = require("highcharts-export-server");

// Initialize the exporter
chartExporter.initPool();
// Chart details object specifies chart type and data to plot

// Usually the same object that you use to configure your charts
// in the frontend. This will be used to specify the chart type
// and data to plot. I will use a bar chart, the same data
// specified in one of the official demonstrations in the HC website
let chartOptions = {
    chart: {
        type: 'bar'
    },
    title: {
        text: 'Historic World Population by Region'
    },
    subtitle: {
        text: 'Source: Our Code World'
    },
    xAxis: {
        categories: ['Africa', 'America', 'Asia', 'Europe', 'Oceania'],
        title: {
            text: null
        }
    },
    yAxis: {
        min: 0,
        title: {
            text: 'Population (millions)',
            align: 'high'
        },
        labels: {
            overflow: 'justify'
        }
    },
    tooltip: {
        valueSuffix: ' millions'
    },
    plotOptions: {
        bar: {
            dataLabels: {
                enabled: true
            }
        }
    },
    legend: {
        layout: 'vertical',
        align: 'right',
        verticalAlign: 'top',
        x: -40,
        y: 80,
        floating: true,
        borderWidth: 1,
        backgroundColor: '#FFFFFF',
        shadow: true
    },
    credits: {
        enabled: false
    },
    series: [{
        name: 'Year 1800',
        data: [107, 31, 635, 203, 2]
    }, {
        name: 'Year 1900',
        data: [133, 156, 947, 408, 6]
    }, {
        name: 'Year 2000',
        data: [814, 841, 3714, 727, 31]
    }, {
        name: 'Year 2016',
        data: [1216, 1001, 4436, 738, 40]
    }]
};

// Export chart using these options
chartExporter.export({
    type: "png",
    options: chartOptions,
    // By default the width of the chart images is of 600
    // In this case, we want a big image
    width: 1200
}, (err, res) => {
    // Get the image data (base64)
    let imageb64 = res.data;

    // Filename of the output. In this case, we will write the image
    // to the same directory of the initialization script.
    let outputFile = "./output-chart.png";

    // Save the image data to a file
    fs.writeFileSync(outputFile, imageb64, "base64", function (err) {
        if (err) console.log(err);
    });

    console.log("The chart has been succesfully generated!");

    chartExporter.killPool();
});
如果你使用 Node.js 运行脚本,请使用:
node index.js脚本将被执行,生成一个成功输出和图像output-chart.png,在这种情况下,带有本示例信息的图像将如下所示:
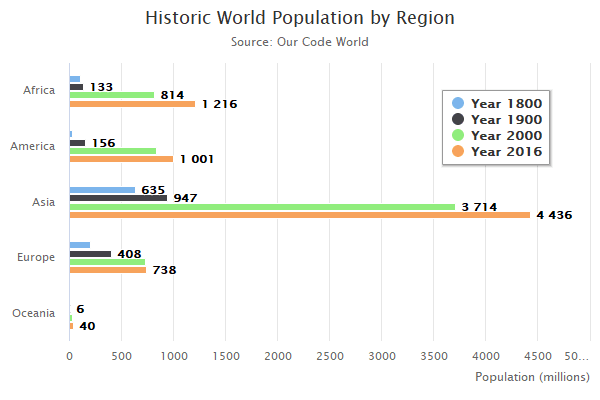
现在可以将图像嵌入到你想要的任何位置,例如浏览器中、PDF 中等。
作为模块使用(导出为 SVG 文件)
如果你想以 SVG 格式导出图表,你也可以使用该模块来完成。你需要使用 SVG 作为值更改 type 属性并提供outfile参数:
// /index.js

// 1. Import filesystem and Highcharts Export Server module
const fs = require("fs");
const chartExporter = require("highcharts-export-server");

// Initialize the exporter
chartExporter.initPool();
// Chart details object specifies chart type and data to plot

// Usually the same object that you use to configure your charts
// in the frontend. This will be used to specify the chart type
// and data to plot. I will use a bar chart, the same data
// specified in one of the official demonstrations in the HC website
let chartOptions = {
    // .. Chart Type, Data etc.
};

// Export chart using these options
// Export the chart as an SVG file
chartExporter.export({
    type: "svg",
    outfile: "./output-file.svg",
    options: chartOptions
}, (err, res) => {
    console.log(`The chart has been succesfully generated as SVG at ${res.filename}!`);

    chartExporter.killPool();
});
B. 使用 Highcharts Export 作为服务
服务器端渲染JavaScript Highcharts的方法:现在,将其用作模块的第一个解决方案非常适合小型应用程序,理论上不会过多地使用该功能。但是,如果你尝试创建一个服务,其中多个应用程序可以与创建图表图像进行交互,那么最好的方法是将该模块作为服务器运行。因此,你需要全局安装 highcharts-export-server:
npm install highcharts-export-server -g安装将提示与作为模块安装、许可证、安装 PhantomJS 等时相同的内容。安装完成后,你应该能够从终端运行命令,使用 enableServer 参数将其启用为服务器:
highcharts-export-server --enableServer 1 --host localhost --port 7801此命令将基本上使用给定的配置启动服务器:
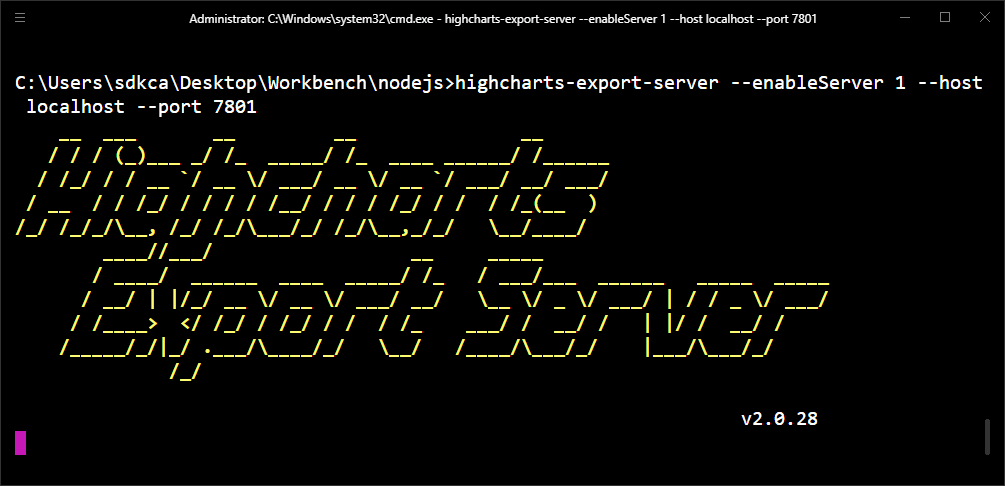
在这种情况下,地址将是http://localhost:7801,因为我在本地工作。如果你想在实时服务器上运行它,你还需要配置反向代理,如果你想在特定域中使用 Nginx。
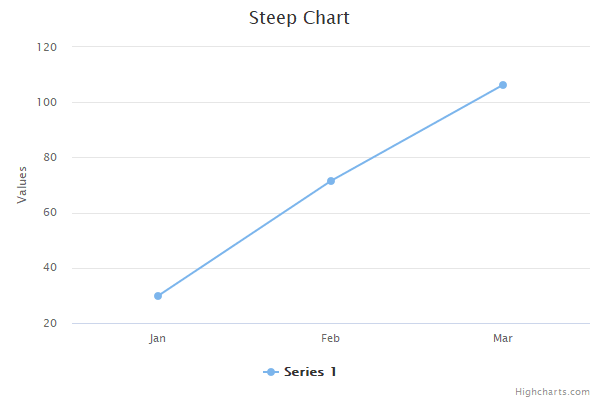
Node.js如何在服务器端渲染JavaScript Highcharts:现在,有了这个,你将能够从 Web 服务呈现图表。application/json使用图表数据向定义的地址执行一个简单的请求,响应将是图表的图像。我们在请求中发送的 JSON 将如下所示:
{
    "infile": {
        "title": {
            "text": "Steep Chart"
        },
        "xAxis": {
            "categories": [
                "Jan",
                "Feb",
                "Mar"
            ]
        },
        "series": [
            {
                "data": [
                    29.9,
                    71.5,
                    106.4
                ]
            }
        ]
    },
    "width": 1200
}
你可以用 curl 测试一下,例如,下面的命令会请求带有之前信息的图表并将其存储在output-file.png文件中:
curl -H "Content-Type: application/json" -X POST -d "{ \"infile\": { \"title\": { \"text\": \"Steep Chart\" }, \"xAxis\": { \"categories\": [ \"Jan\", \"Feb\", \"Mar\" ] }, \"series\": [ { \"data\": [ 29.9, 71.5, 106.4 ] } ] }, \"width\": 1200 }" localhost:7801 -o output-file.png在这种情况下,响应将是:
快乐编码❤️!

